2. Panel tour
Fourteen panels. You'll use four of them daily, six of them weekly, and the rest the occasional Tuesday afternoon when something exotic breaks.
This chapter is the map. Each panel gets a one-paragraph "when you'd open this" answer; the chapters that follow take the four hero panels — Event detail, Time travel, Trace, Click-to-source — and unpack them depth-first.
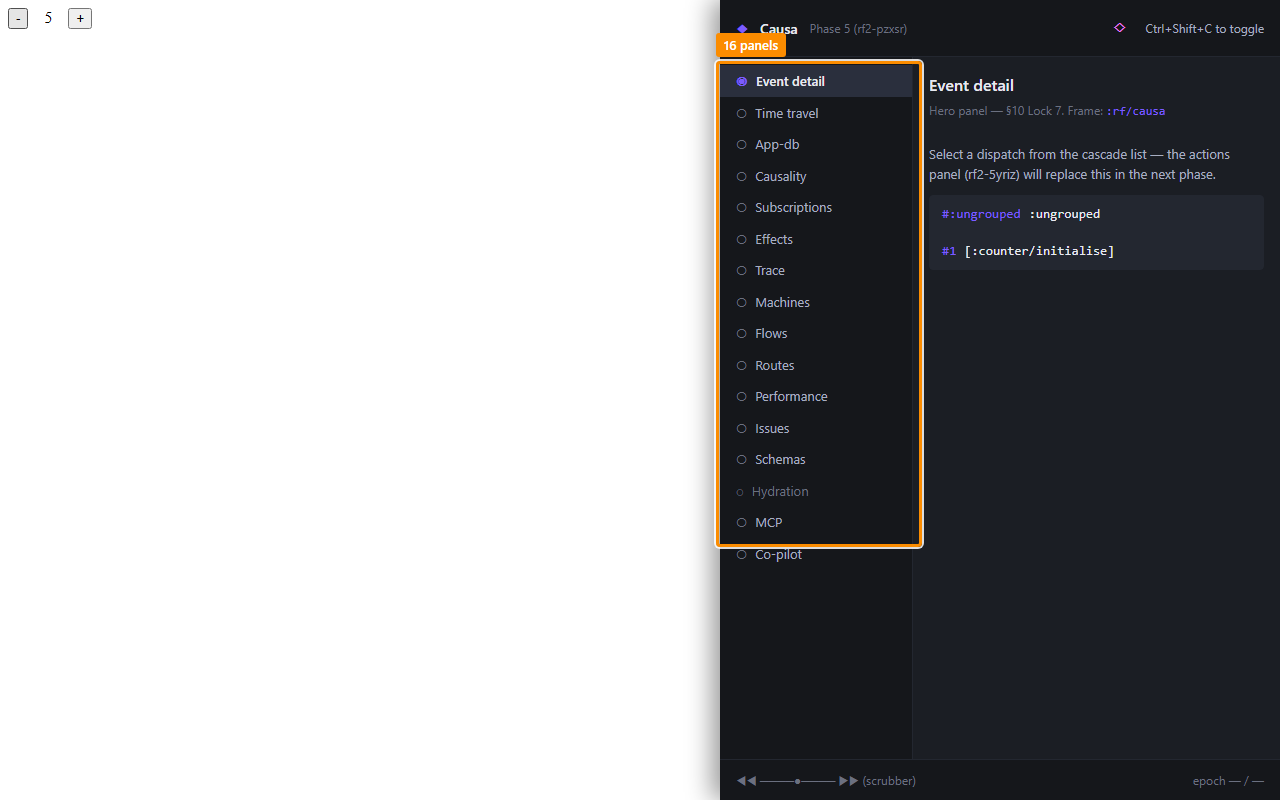
The sidebar groups panels into two bands:
- Always-active (top) — Event detail, Time travel, App-DB, Subscriptions, Effects, Trace, Machines. These render whether you've configured anything or not.
- Conditional-with-activity (bottom) — Flows, Routes, Performance, Issues, Schemas, Hydration. These light up only when the app is using the relevant subsystem (the Hydration panel only appears when SSR hydration actually runs, etc.).
Event detail — the landing panel
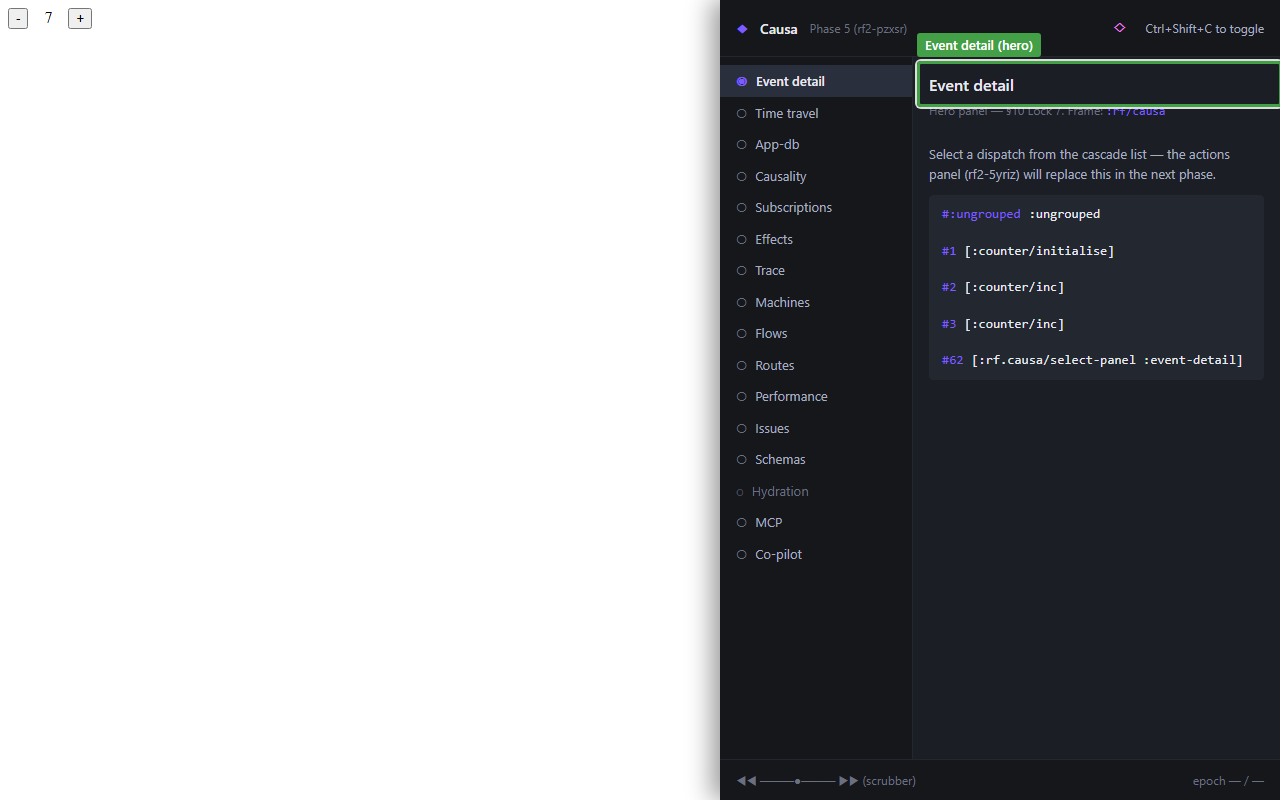
Lands on every open. Renders the most recent epoch — the event vector, the app-db diff, the inline mini-graph of what cascaded, the subs that recomputed, the views that re-rendered, the fxs that fired, and the duration. If you're answering "what did the user just do?", this is the panel.
Five questions every event answers, all on first paint:
- What was dispatched? Event vector, top of the panel.
- What changed? App-db diff, expanded.
- What rendered? Render list, keyed by view-id.
- What fxs fired? Effects list, with
:outcome ∈ {:ok :error :skipped-on-platform}. - How long? Total cascade duration.
That's the daily answer set. Anything deeper, you click through to a peer panel.
Time travel — the bottom rail
The scrubber is always visible at the bottom of the shell — even when you're on a different panel. Drag it backwards to passively re-render against a prior epoch's :db-after; click restore to make it sticky (the runtime calls restore-epoch and the live app rewinds).
See the dedicated chapter 3.
App-DB — slice-centric
Not a full app-db tree dump. The slices that changed in the current epoch, plus any slices you've pinned with a watch gesture. Read-only — Causa never writes to app-db for you (use re-frame2-pair for that, or dispatch a real event).
See chapter 9.
Subscriptions
Every registered sub: id, layer (extractor / derivation), current value, hit-rate badge (TanStack-style — stale / fresh / inflight), and the recompute count this session. Click an edge to walk to a parent sub. Click an id to jump to its reg-sub.
The TanStack-style badge is unusual for a re-frame tool — it's there because sub recomputation cost is one of the four canonical performance hot-spots, and the panel surfaces it where you'd reach for it anyway.
Effects
Every fx the app has issued in the current session, keyed by fx-id, with :outcome chips and full :tags payload. Errors get red rows; aborts get yellow. Click a row to see the full trace event.
Trace — the raw stream
Every emitted trace event, in order. Filterable by :op-type, by tag, by free-text. The Trace panel is what you'd write yourself with register-trace-cb! if Causa didn't exist — it's the bus's most direct rendering.
See chapter 4.
Machines — Stately-grade state-charts
For every registered machine, the panel renders a Stately-quality state-diagram: nodes for states, edges for transitions, guards on edges, actions on entry/exit, parallel regions as side-by-side boxes, hierarchical states nested. The current state is highlighted live; transitions paint as they fire. (Screenshot in chapter 8.)
Embedded under the hood is tools/machines-viz/ — a separate visualiser library that Causa composes in.
See chapter 8.
Flows
Registered flows — re-frame2's reactive-derivation primitive. Per-flow status, last value, the inputs it watches, the last few recomputes. Only lights up if your app registers any.
Routes
Static route table, plus the current route, plus the per-frame route history. Useful when "the URL changed and the page didn't" or vice versa.
Performance
The rf:-prefixed User Timing entries (event / sub / fx / render) plotted on a millisecond scale. Off by default — it's the channel covered in Guide 16 — Performance. Turn it on when you're looking at a specific slow render.
Issues
The unified feed: errors, warnings, schema violations, hydration mismatches. One row per issue, with severity chip, source coord, and the underlying trace event one click away. This is where you check first when "something looks off."
Schemas
The schema-violation timeline. One row per registered schema (app-db slot, sub return, event payload, cofx). Coloured dots per failure with recovery mode. Lit up only if you've registered any Malli schemas — see Guide 04a — Schemas.
See chapter 6.
Hydration
The server-vs-client hydration debugger. Only visible when SSR hydration actually runs in the page. Side-by-side render trees with the diff highlighted.
See chapter 7.
Resizing Causa
Drag the left edge of the Causa panel to resize horizontally. Width persists across reloads (per-Causa-instance, stored in localStorage). Double-click the handle to reset to default width.
For full-screen inspection, change Settings → General → Panel position to fullscreen. For an out-of-window view, change it to popout — the browser's window controls then govern size.
How the panels share state
Every panel reads the same store. Selecting an event in Event detail highlights the corresponding row in Trace and pins the App-DB diff to that epoch. Dragging the time-travel scrubber retargets every panel at the historical epoch. Clicking a sub in Subscriptions opens its source in your editor (next chapter), pins it in App-DB, and highlights its incoming edge in the static sub-graph.
The state is one big sub-graph rooted at Causa's app-db — a separate frame from your app's. That separation is what lets Causa survive restore-epoch on the host frame: the historical view is a projection over the rewound host, not a rewound Causa.
You don't have to know any of this to use the tool. But it's how the panel composition is so cheap to extend — adding a fifteenth panel is "register one slot, render one view"; the substrate is already there.
Next: time-travel scrubbing — the rail at the bottom of every panel.