Xray
You have a running re-frame2 app and something just happened. A button was clicked, a handler ran, a subscription recomputed, a view rendered, a machine moved, a route changed, or a schema shouted. Xray is the tool that lets you read that cascade as one coherent story instead of spelunking through logs and browser DevTools.
Xray is the in-app devtools panel for re-frame2. It reads the framework's trace bus, epoch history, source coordinates, registries, and frame state; it does not invent a second runtime beside your app. That is the important idea. The app already knows what happened. Xray gives that knowledge a usable shape.
The One-Minute Model
Every settled dispatch produces an epoch. An epoch is the useful unit of debugging: the event that started it, the app-db before and after, the effects that ran, the subscriptions that recomputed, the views that rendered, and the trace records emitted along the way.
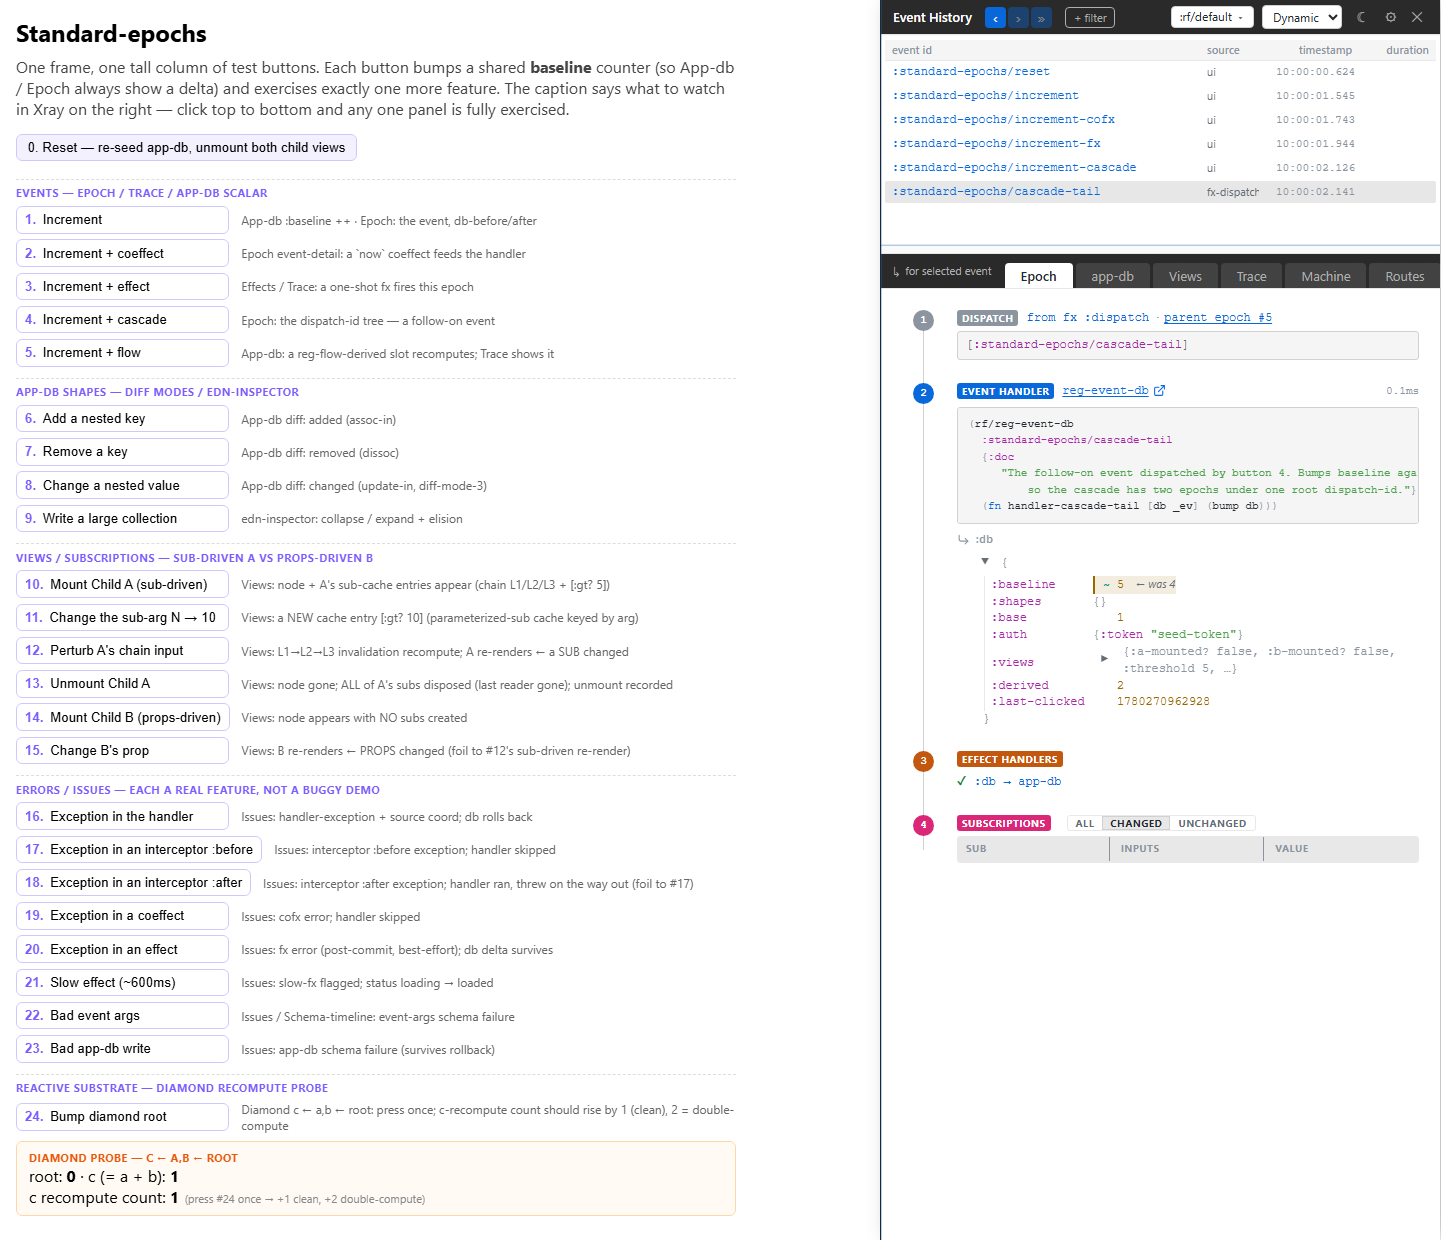
Xray's main UI is built around that fact:
- The top ribbon chooses mode, frame, filters, settings, and visibility.
- The event spine lists recent epochs for the selected frame.
- The tab strip chooses which lens you want.
- The detail panel shows that lens for the focused epoch.
When you click a row in the event spine, every tab rebinds to that same epoch. Epoch, app-db, Views, Trace, Machine, and Routes stop disagreeing because they are all projections of the same record.
Two Modes
Use Dynamic mode when you are asking: "What just happened?"
Dynamic mode has the event spine. Pick an event, then read the epoch, app-db diff, view activity, trace rows, machine movement, or route activity for that focused cascade.
Use Static mode when you are asking: "What exists in this app?"
Static mode drops the event spine and browses registered things: machines, routes, schemas, flows, and interceptors. It is quieter because it is not tied to one event.
What To Learn First
Start by installing Xray, then run one small debugging session on the standard-epochs testbed or your own app. The rest of the tutorial is organized around the questions you will naturally ask once the panel is open.
- 1. Installation shows the dev dependency, host element, preload, and launch controls.
- 2. Panel tour teaches the shell, the event spine, Dynamic mode, Static mode, and the six daily tabs.
- 3. Time-travel scrubbing shows LIVE versus RETRO focus and how to inspect past epochs without losing your place.
- 4. Trace stream explains when to use the friendly Epoch lens and when to drop to raw trace rows.
- 5. Click-to-source connects rendered DOM and Xray rows back to editor locations.
- 6. Schema-violation timeline shows how validation failures surface inline now that the old Issues tab has been retired.
- 7. Hydration debugger covers SSR hydration mismatches and how Xray helps locate the first divergent node.
- 8. Machine inspector covers the event-coupled machine lens and the Static machine browser.
- 9. App-DB diff teaches the changed-slices-first app-db view.
- 10. Derivation graph draws subscriptions, flows, resources, routes, and machines as one dependency graph — "where does this value come from?" — with static/live modes and the off-box redaction boundary.
What Xray Is Not
Xray is not a replacement for your editor, your tests, Story, or browser performance tooling.
It is a diagnostic reader over re-frame2's runtime substrate. It does not write your app-db for you. It does not secretly monkey-patch handlers. It does not ship in production. It helps you answer the five questions that matter when a re-frame2 app behaves strangely:
- What event started this?
- What state changed?
- What effects ran?
- What subscriptions and views reacted?
- Where in the source should I look next?
That is the tutorial's job: make those questions feel routine.